Fiber Optic Amplifier Monitoring Demonstration Dashboard

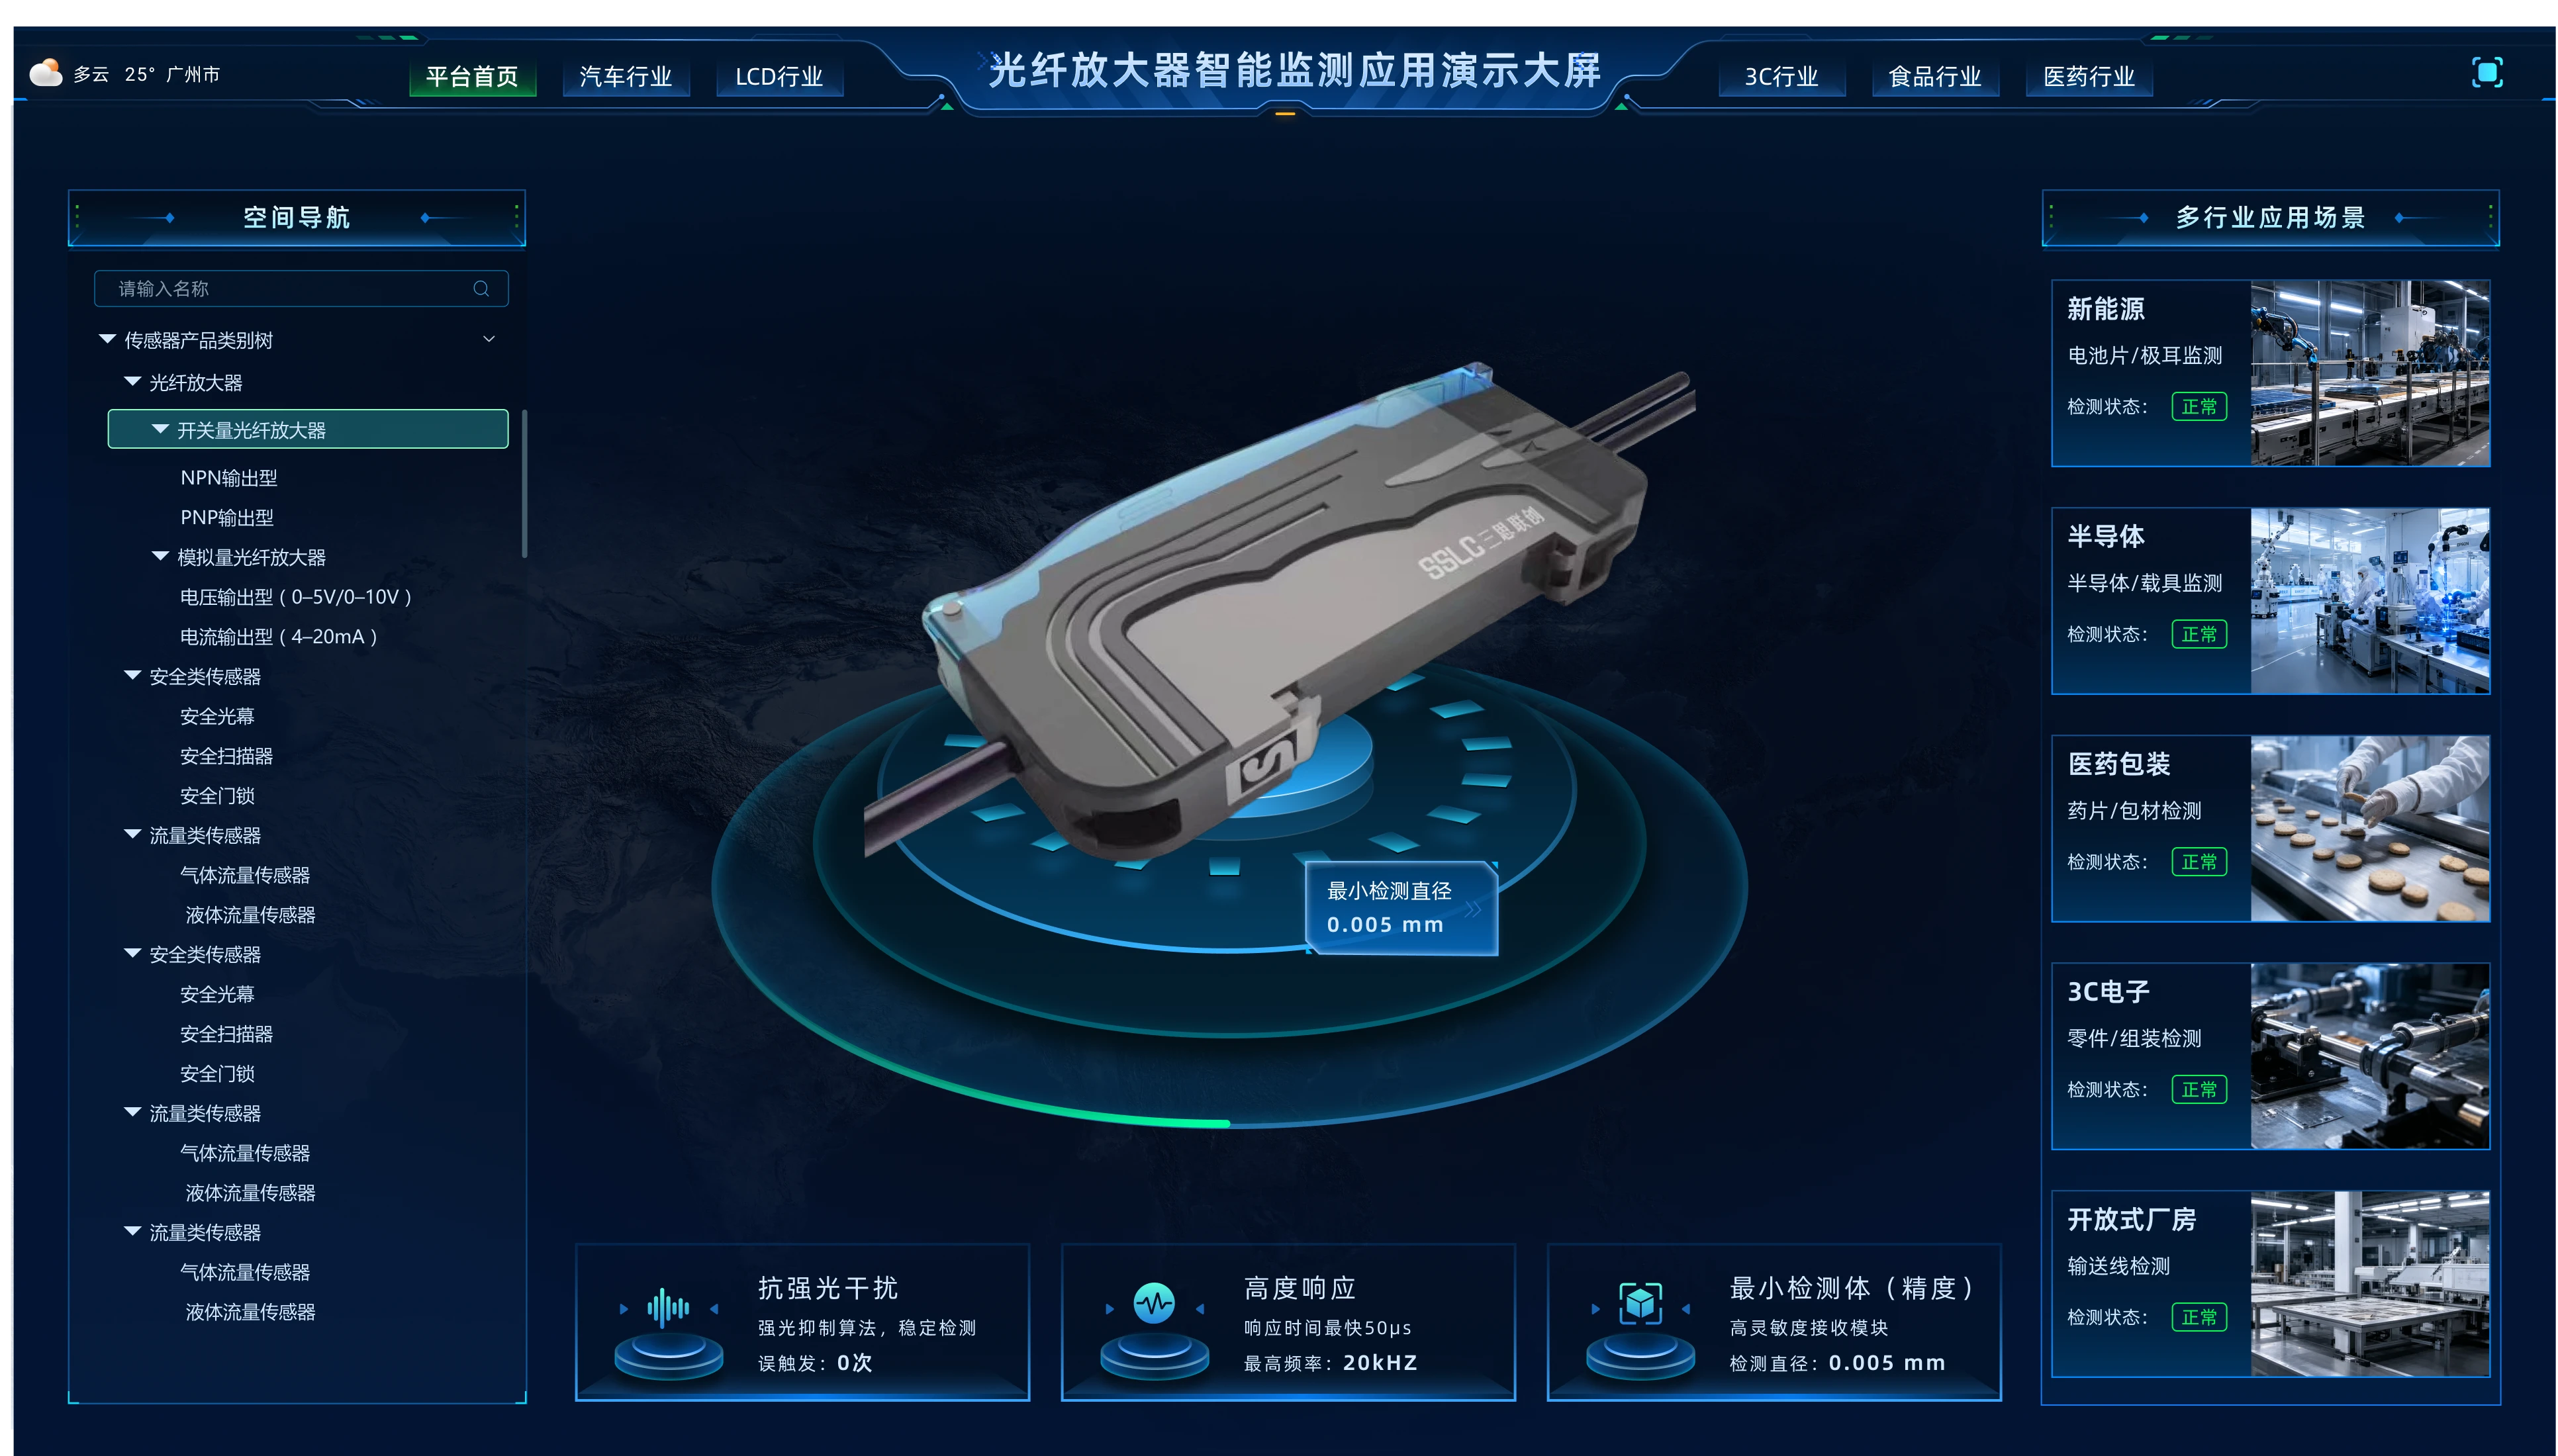
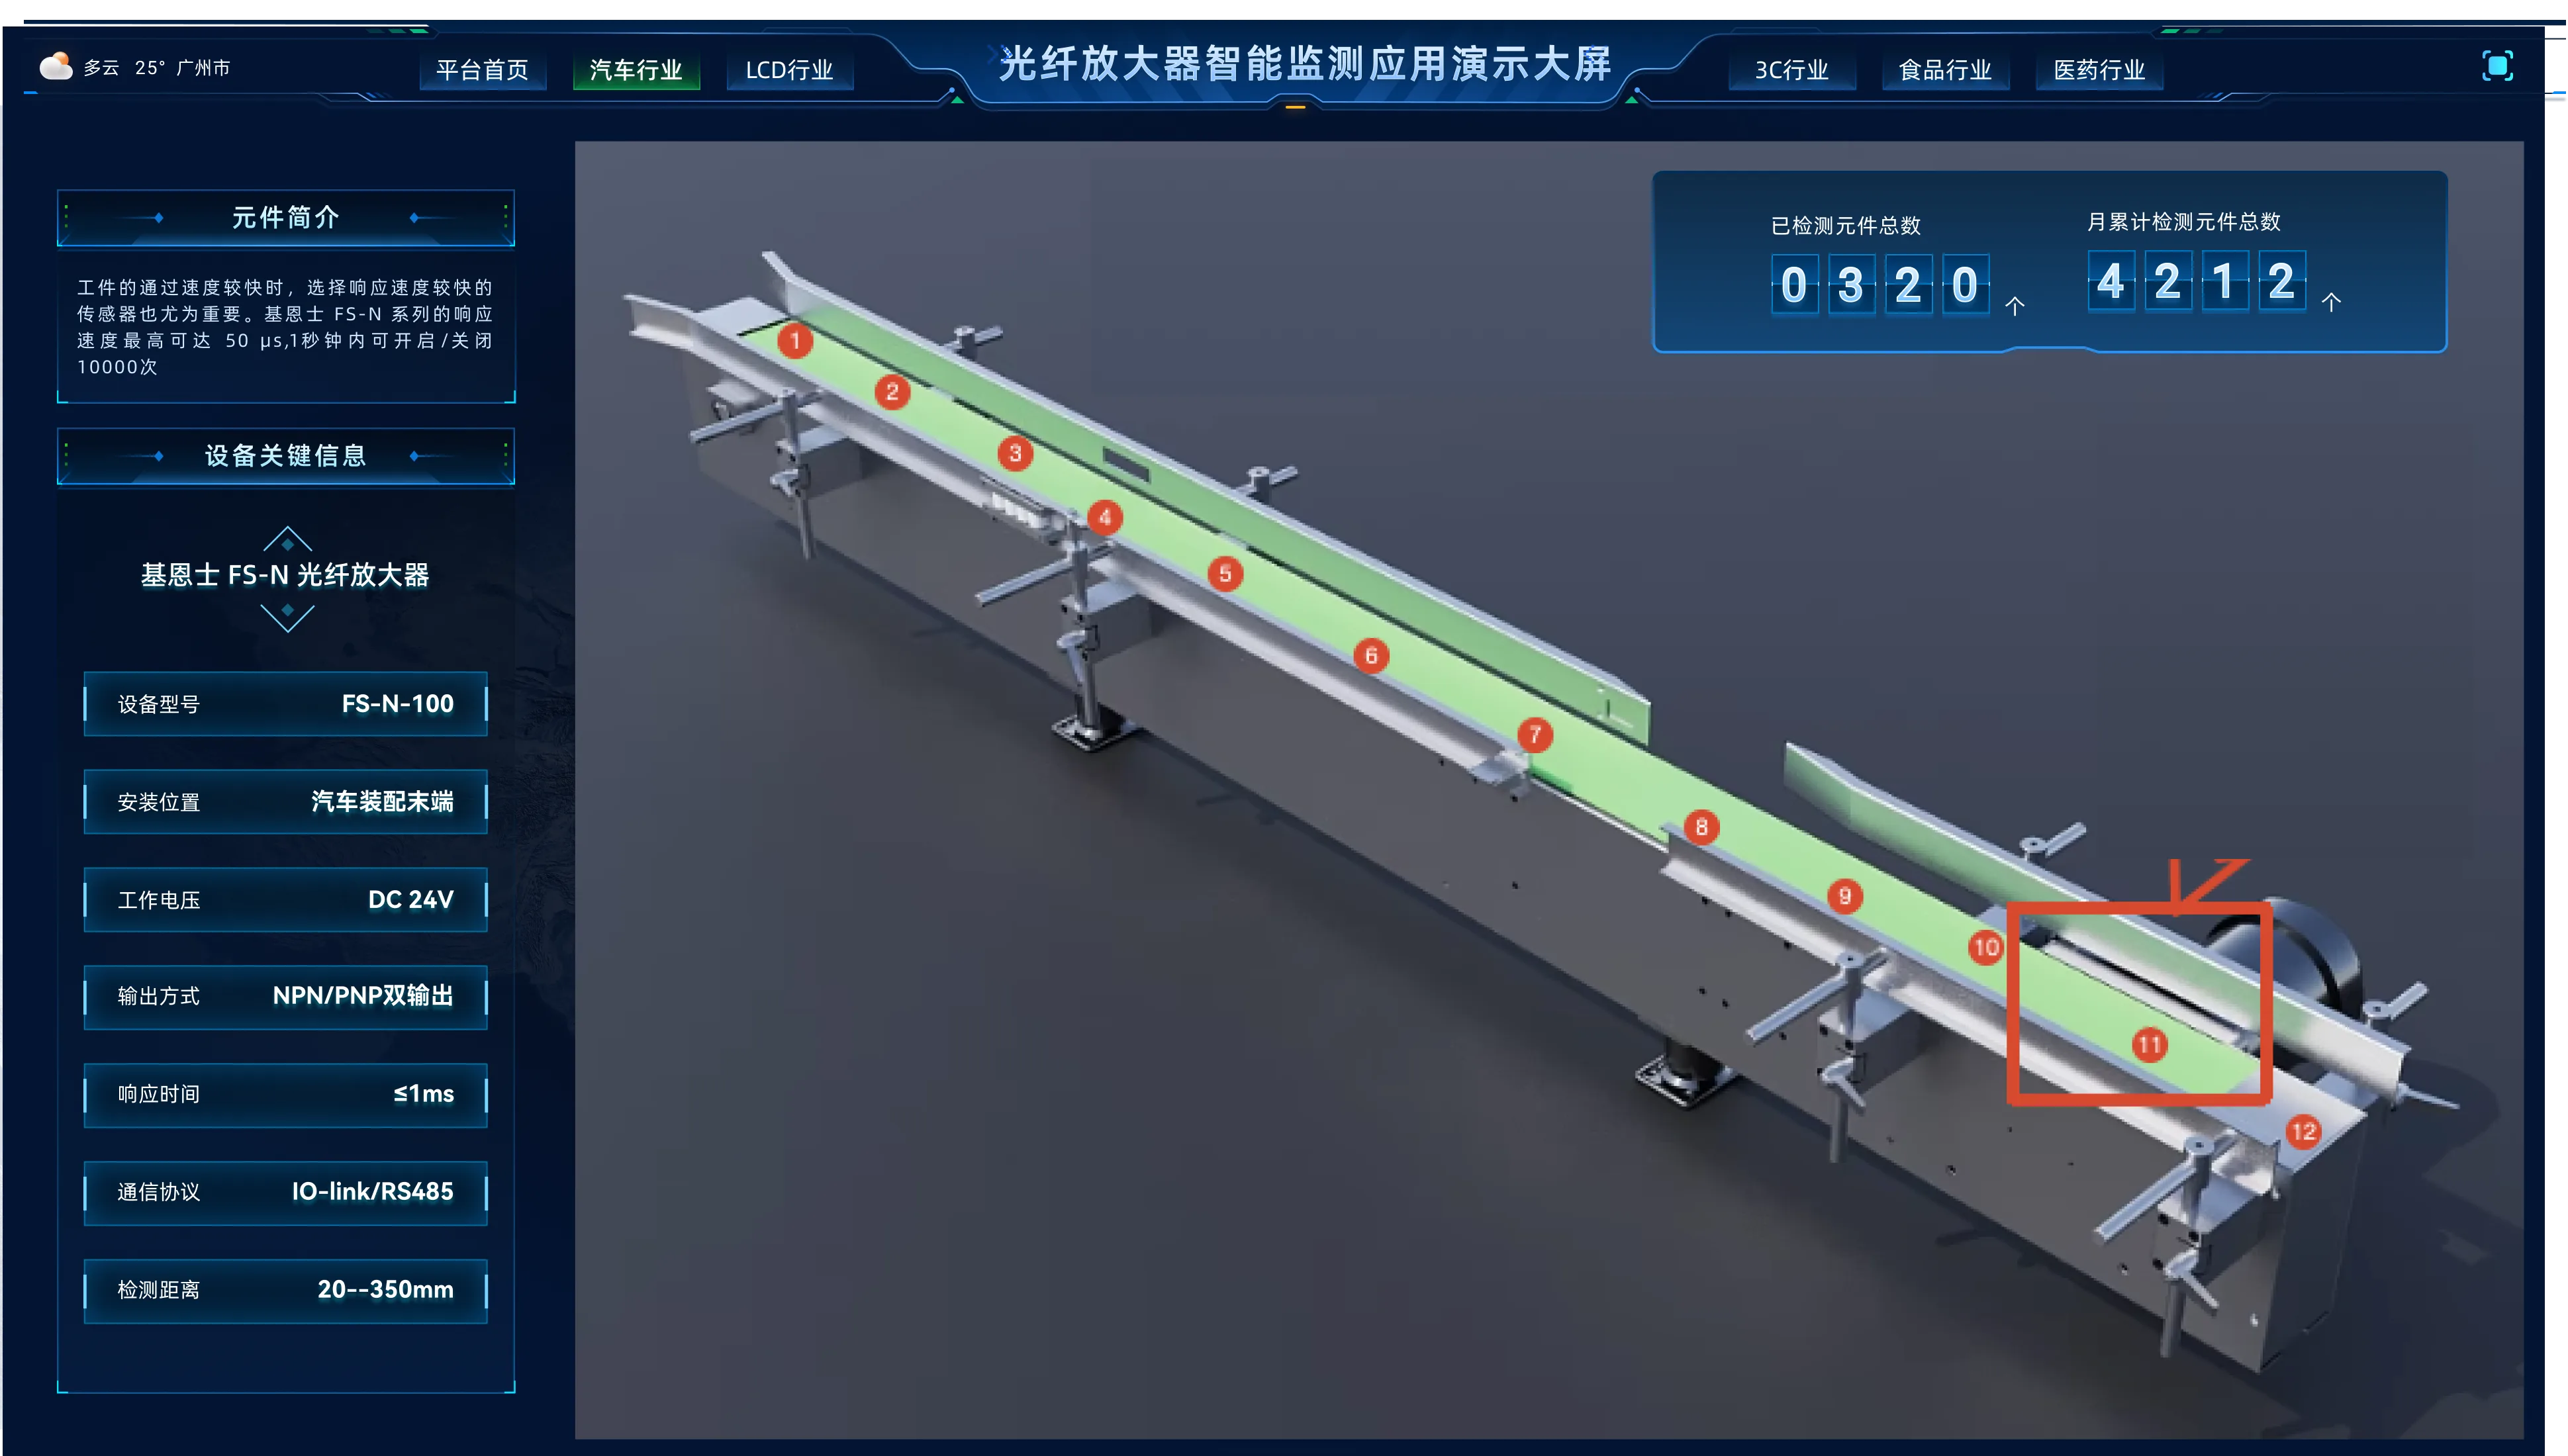
The dashboard organizes fiber optic amplifiers and related sensors through product categories, 3D models, device specifications and industry scenarios. Its overview combines a product model with category navigation, presenting characteristics such as light-interference resistance, response speed and detection precision alongside applications in new energy, semiconductors, pharmaceutical packaging and electronics manufacturing. An automotive view connects device information with a conveyor line, numbered detection points and detection counts to support product presentations and application discussions.

Sensor categories, 3D product and industry application overview

Project Highlights

Connect product models with application scenarios

A sensor category tree and 3D product model organize the product range, placing key characteristics alongside industry applications. This connects product form, detection uses and operating environments for clearer demonstrations and product-selection discussions.

Understand detection in the context of a production line

The automotive view uses a 3D conveyor model and numbered points to explain detection locations. Device models, installation positions, power supply, output types and communication protocols appear alongside detection counts, linking technical specifications with their role on the line.