

Requirements and orchestration
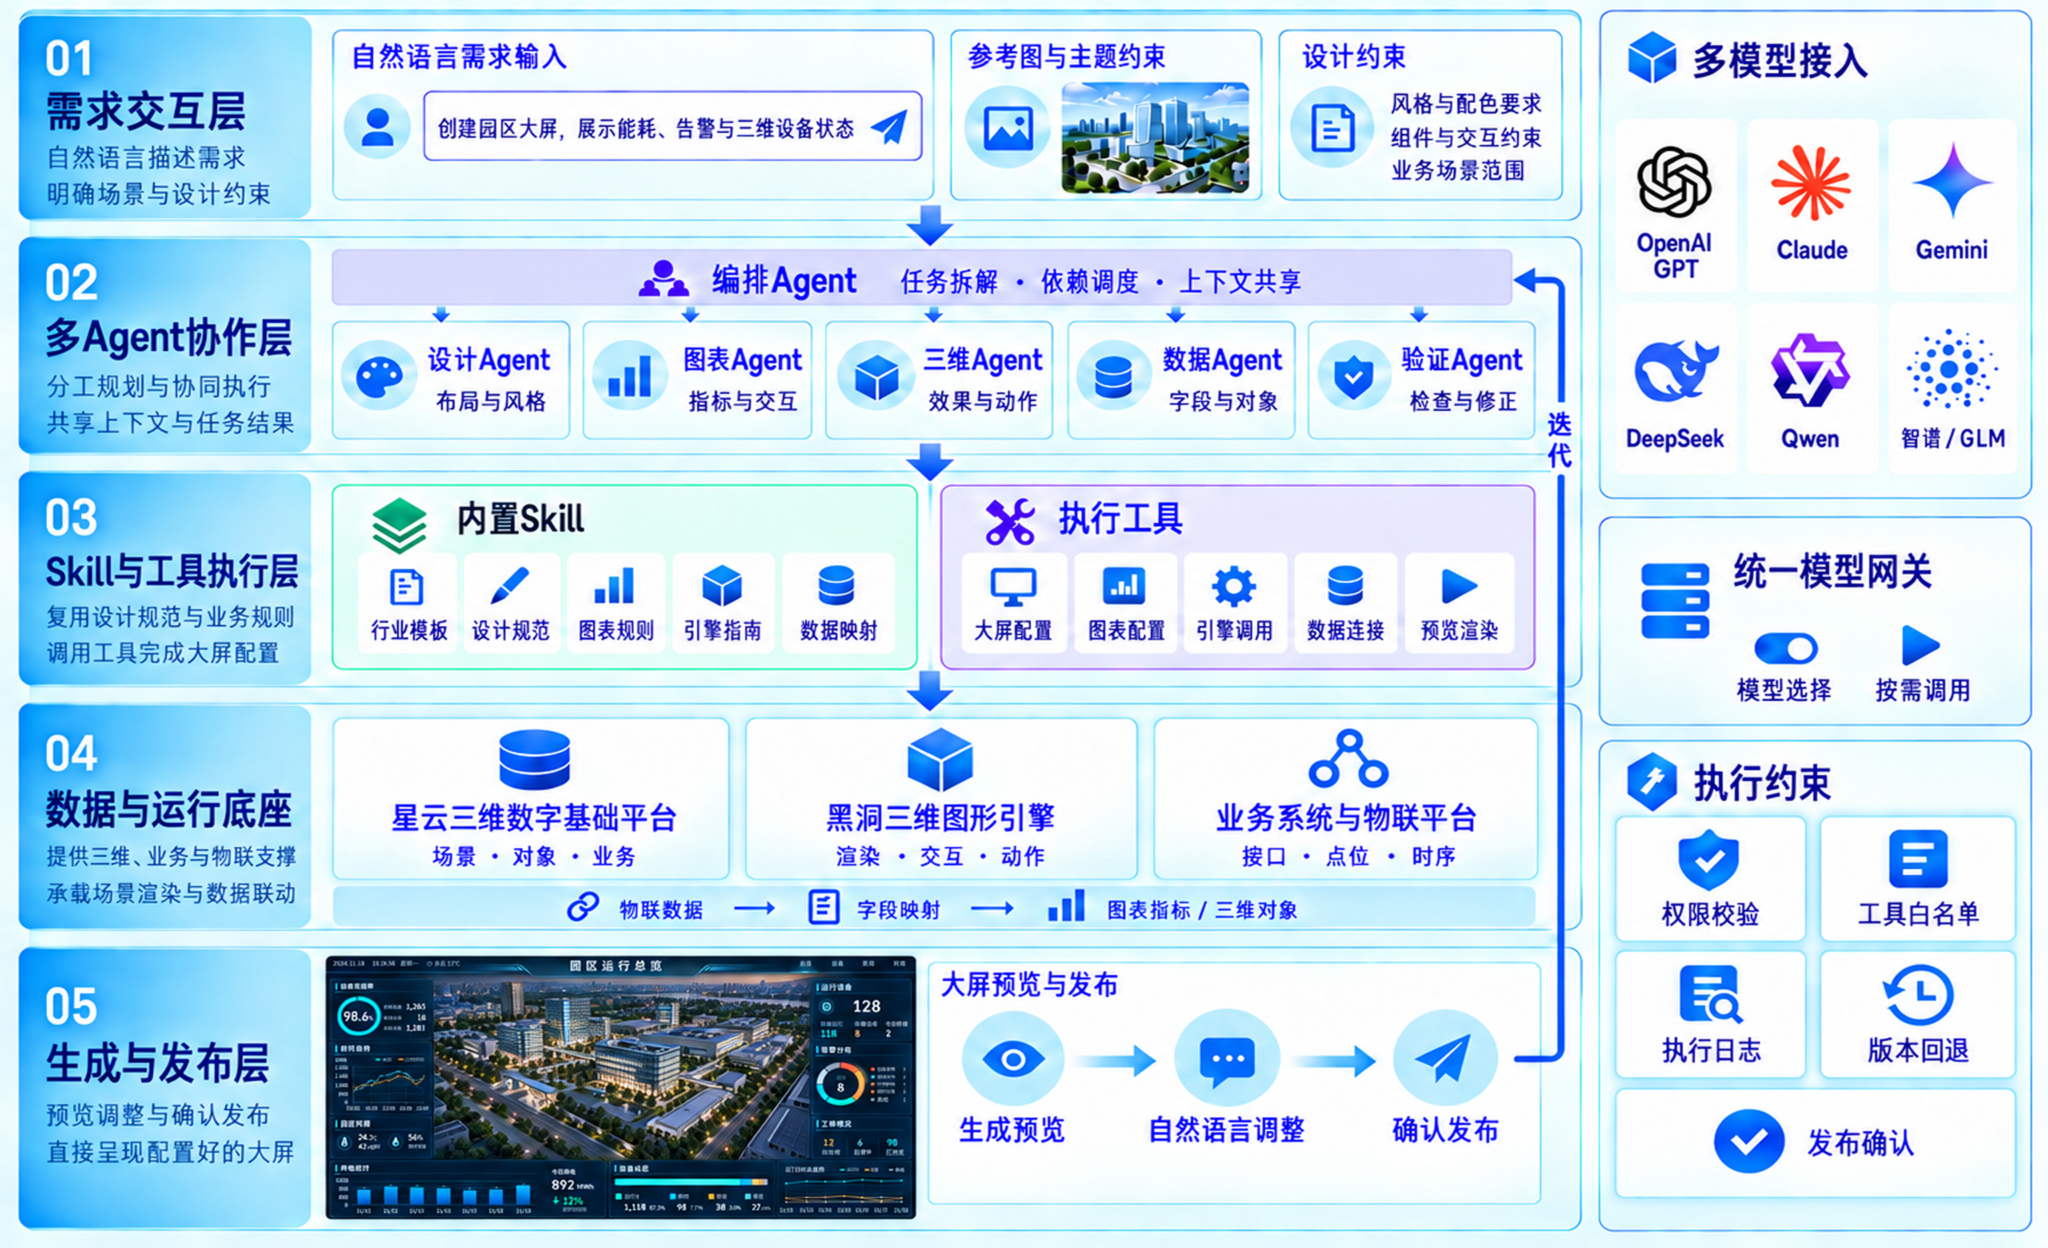
Combine natural language, reference images and design constraints to coordinate design, chart, 3D, data and validation agents.
Describe the presentation objective, then compose editable charts, indicators, 3D scenes and front-end components into a configurable engineering command display.
From natural-language requirements to dashboard generation, specialized agents coordinate design, charts, 3D scenes and data through configuration, preview and publishing.
Combine natural language, reference images and design constraints to coordinate design, chart, 3D, data and validation agents.
Reuse built-in skills and tools to configure scenes and components, connecting the 3D platform, graphics engine, business systems and IoT data.
Access models through a unified gateway with permission checks and tool controls. Refine previews through conversation, track execution and roll back versions before confirming publication.
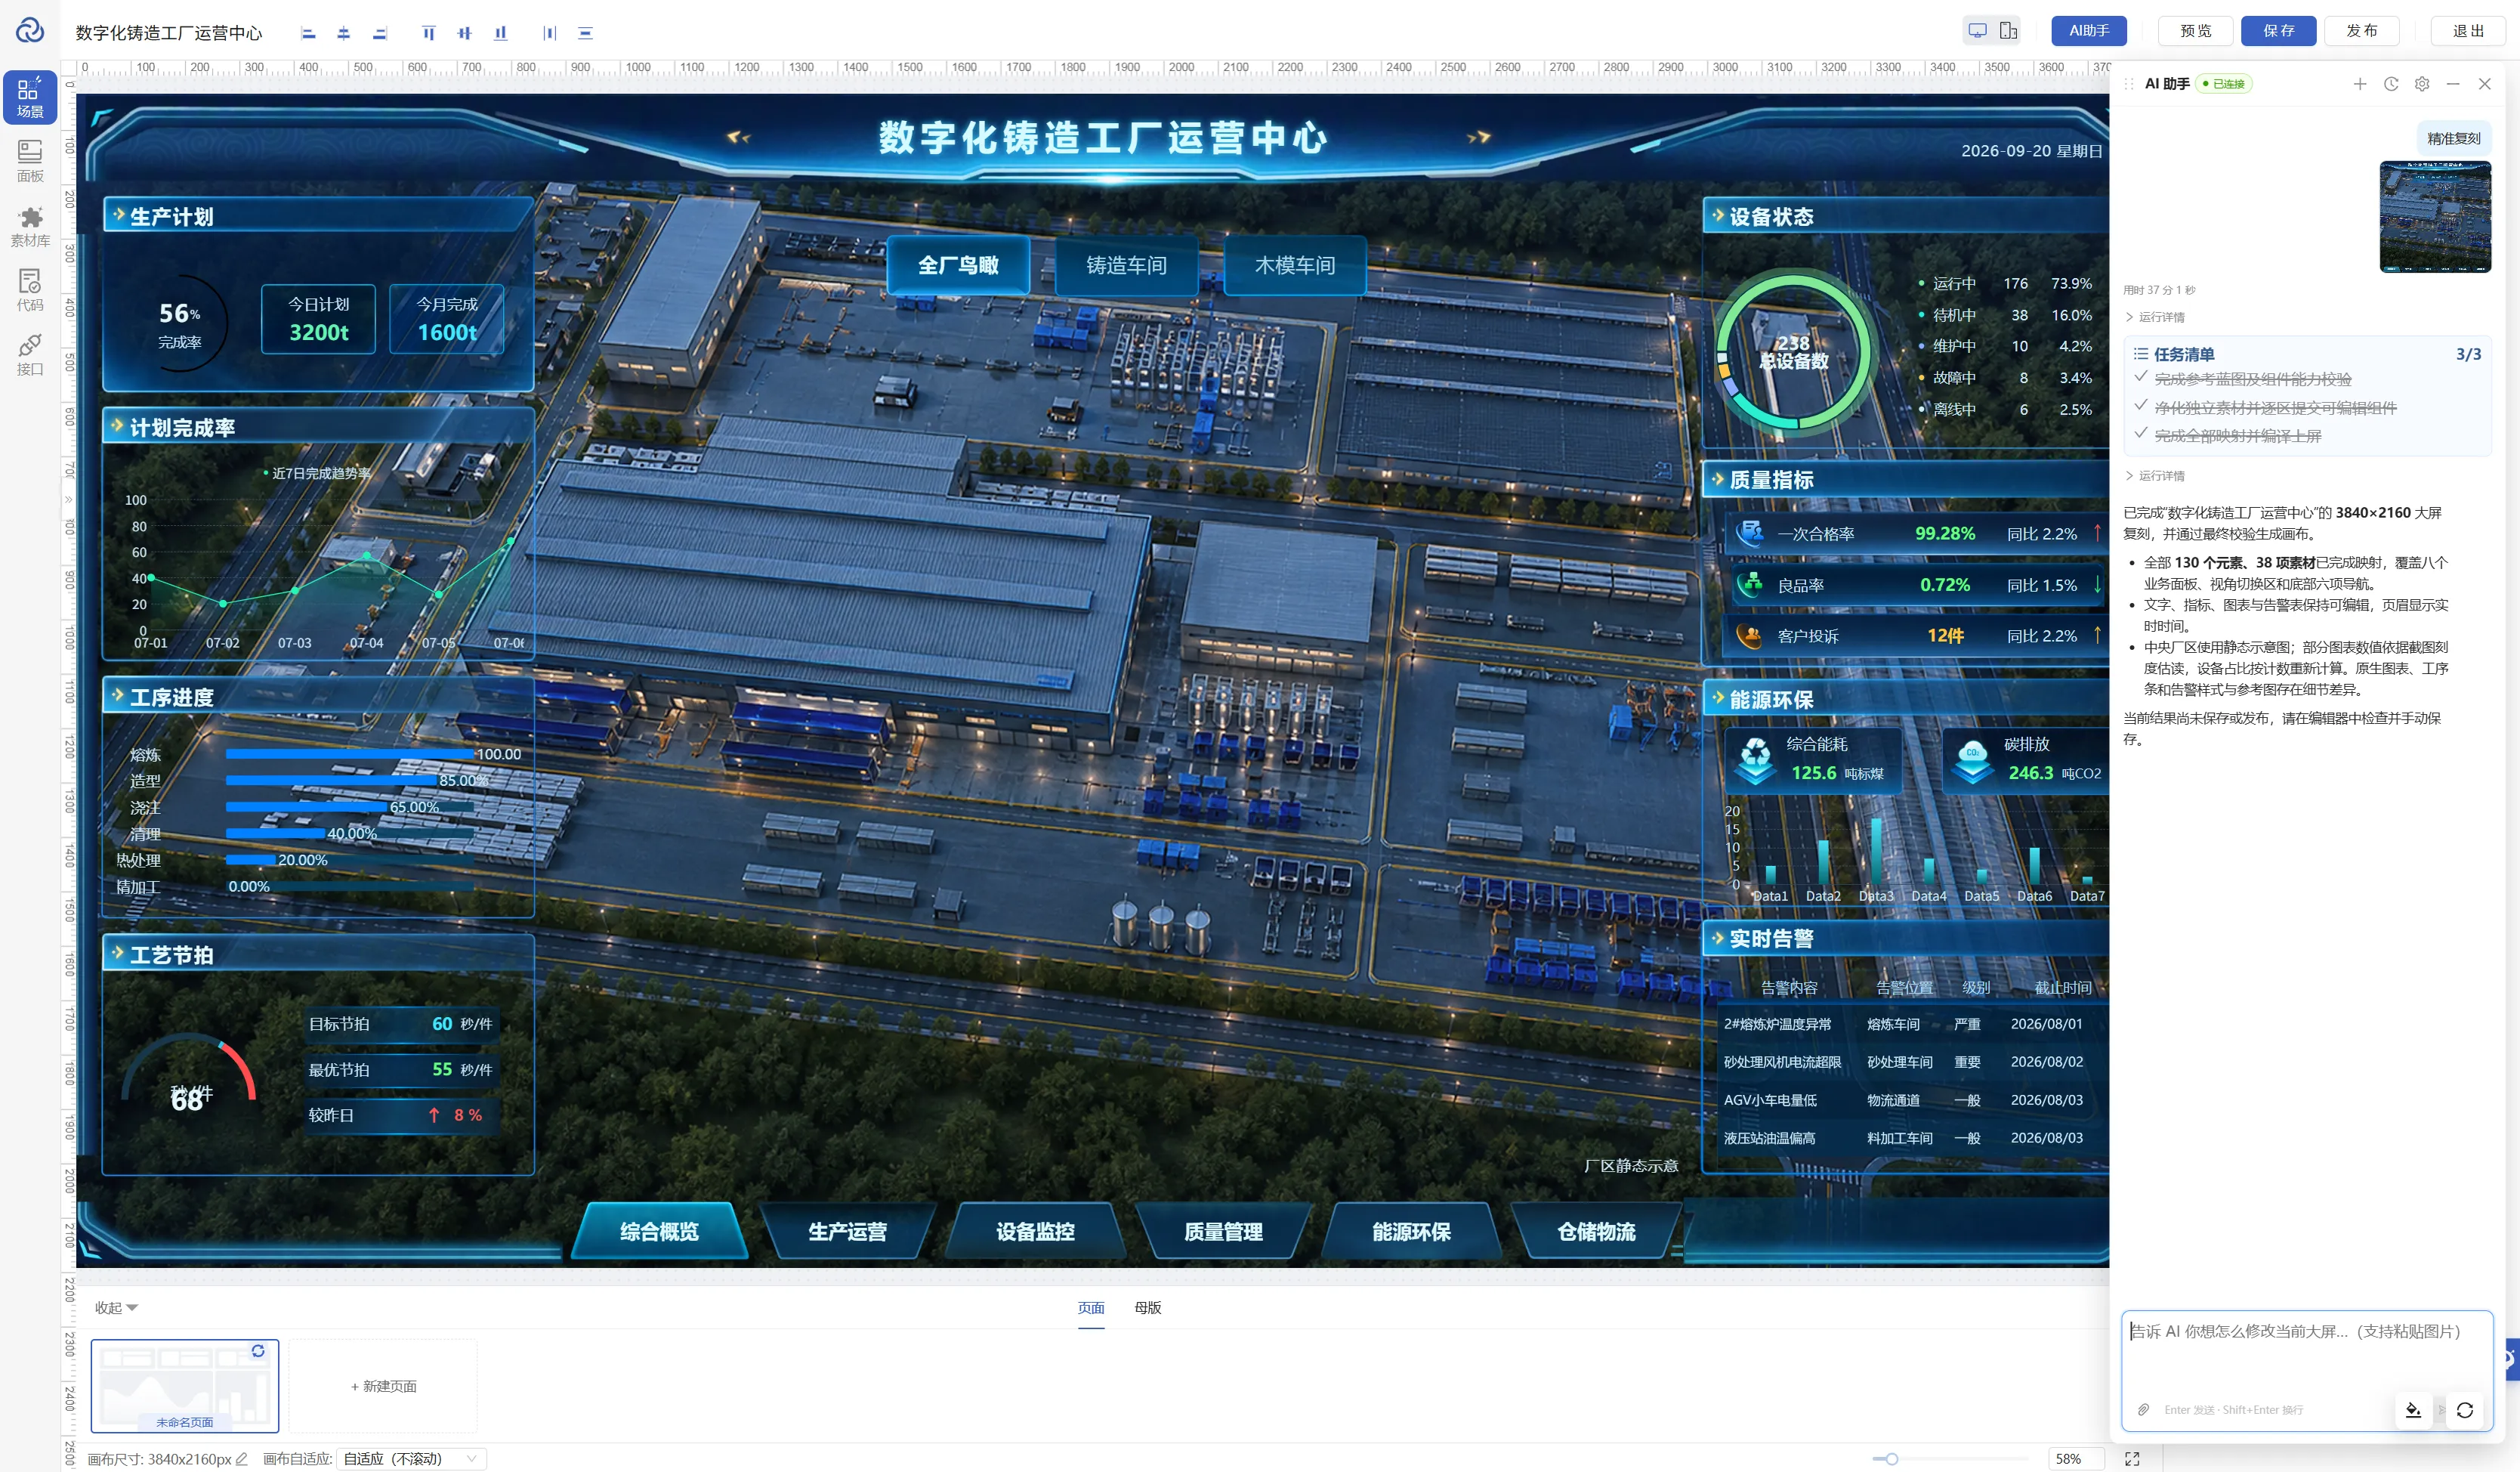
Describe what your business needs to show. Let AI help build the dashboard, connect 3D scenes and data, and refine the details through conversation—from an idea to an editable, interactive display ready to publish.
Describe the project progress, equipment status or site operations you want to show. AI drafts an editable dashboard around your goals, metrics and layout, reducing the work of assembling a page from scratch.
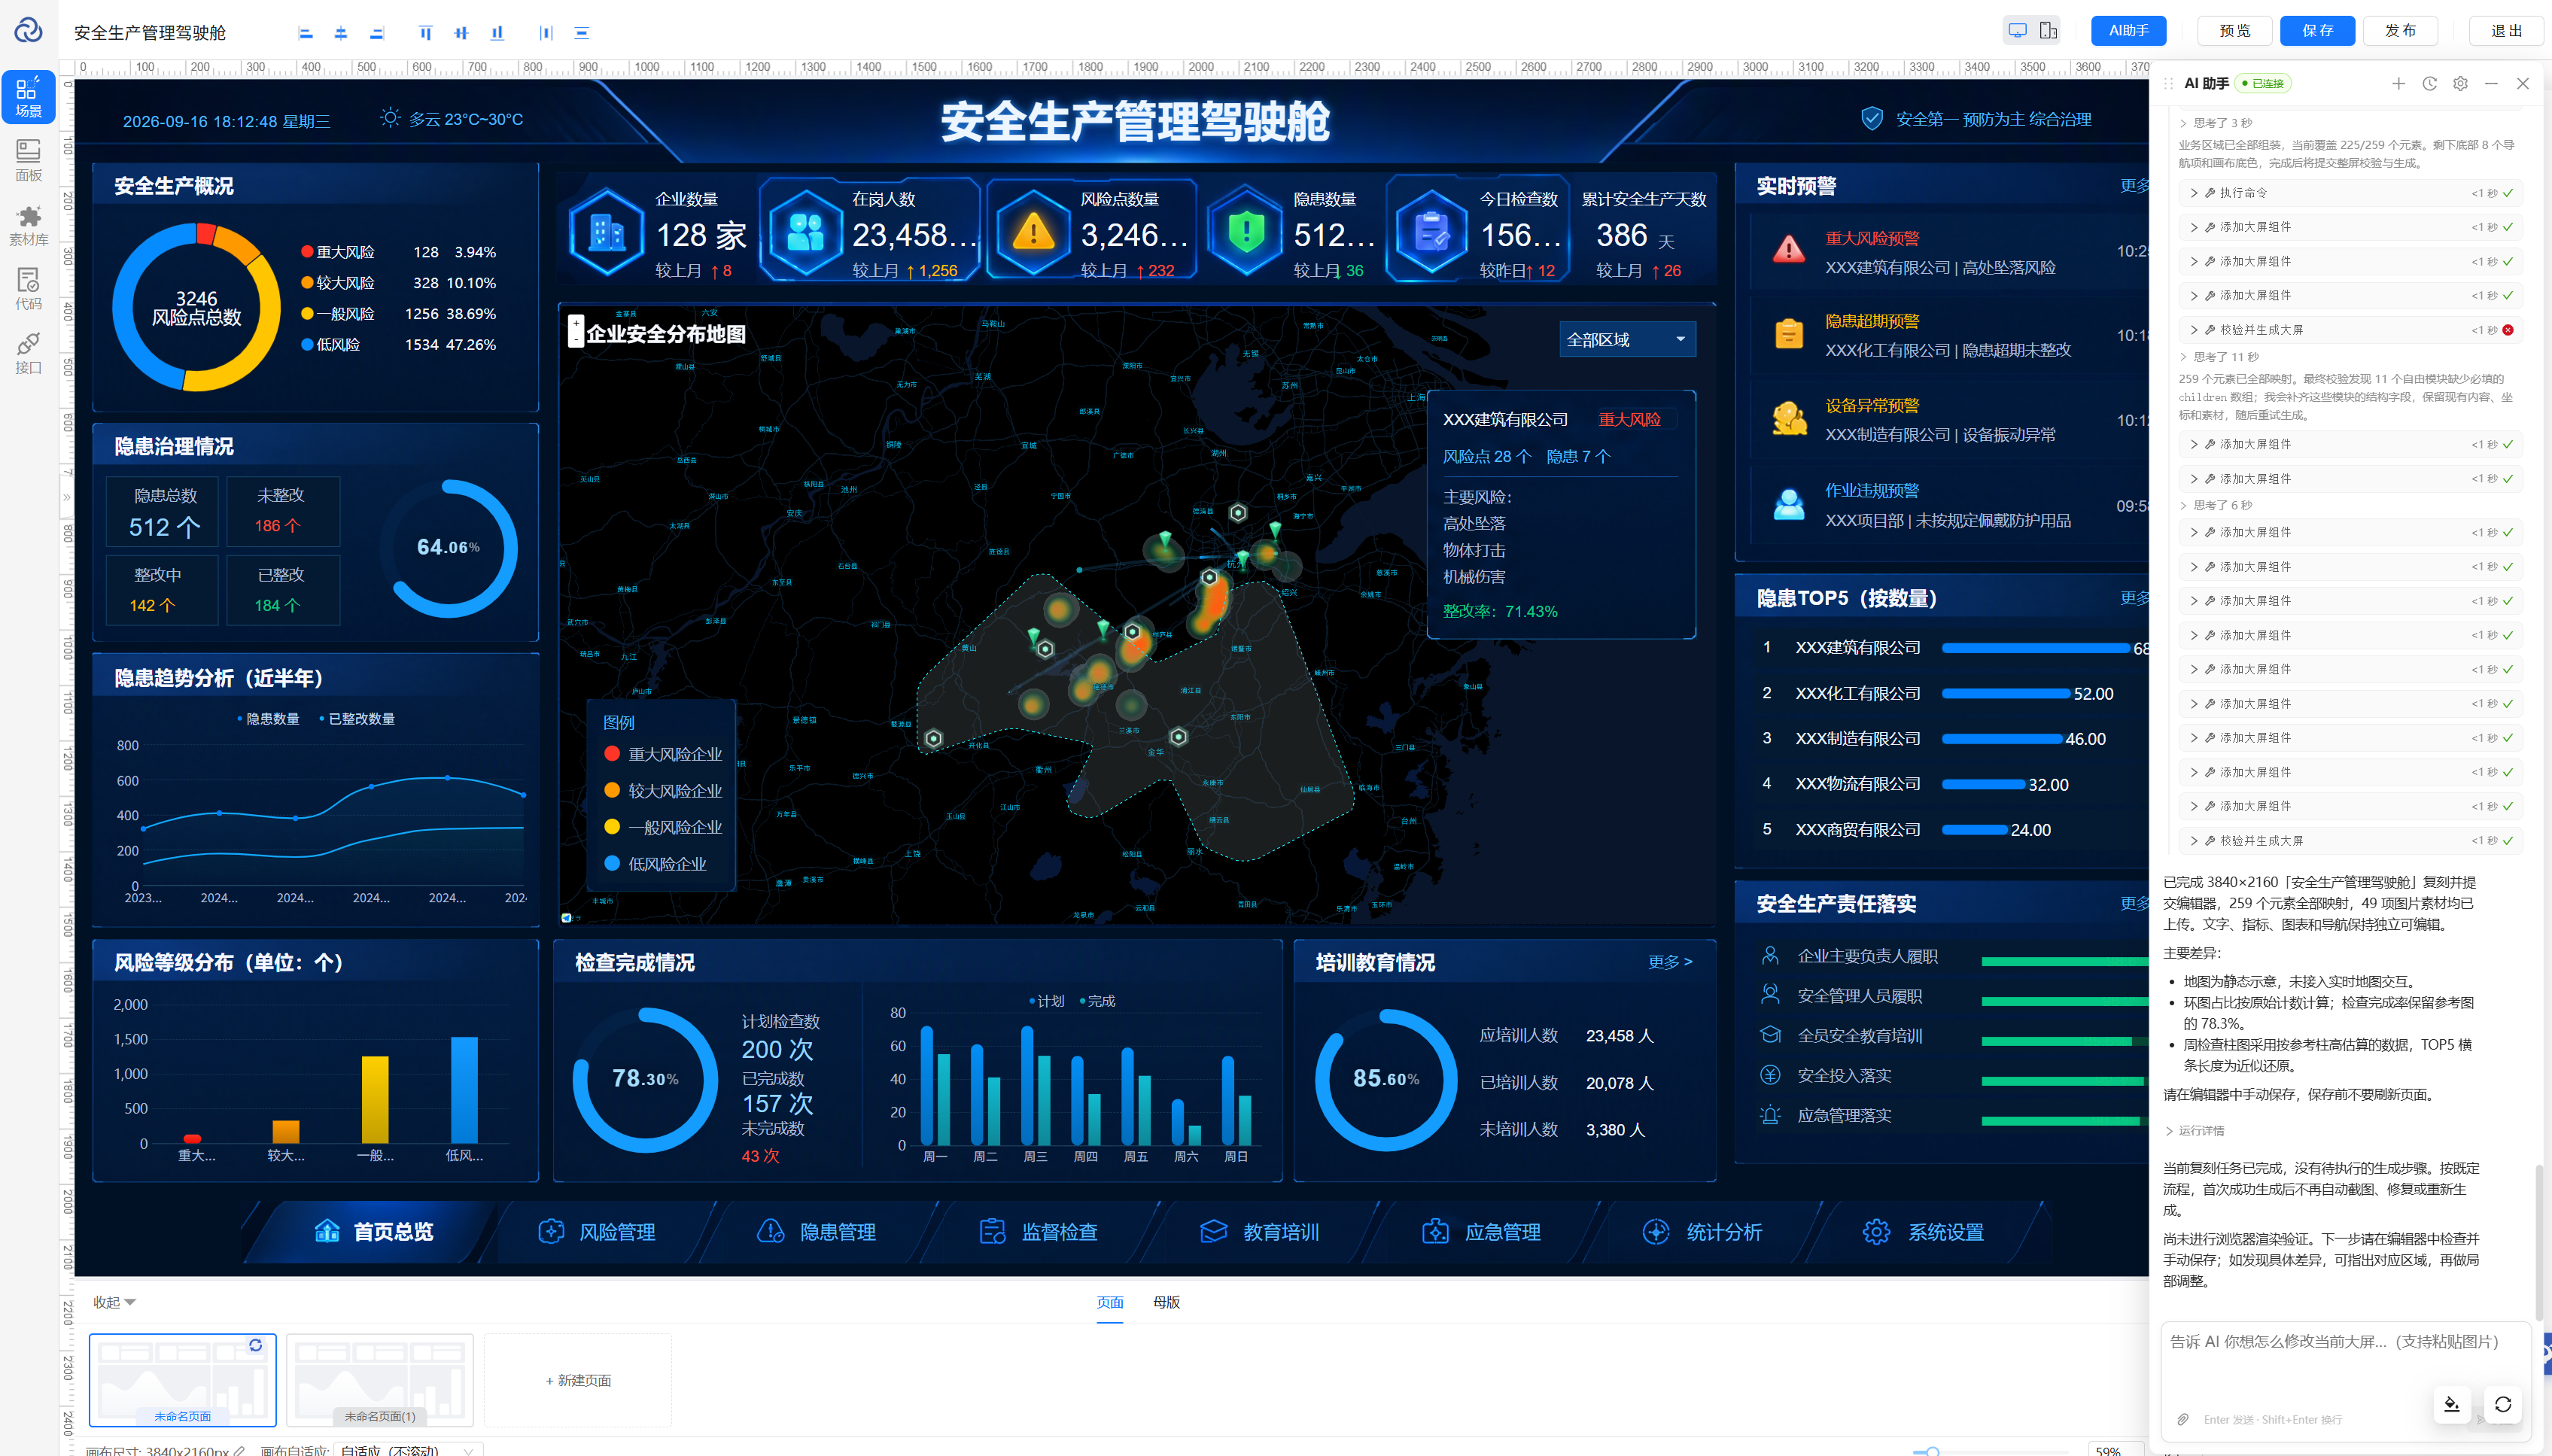
Describe the changes you need instead of switching between configuration panels. AI helps update models and related data so you can see the changes directly in the dashboard.
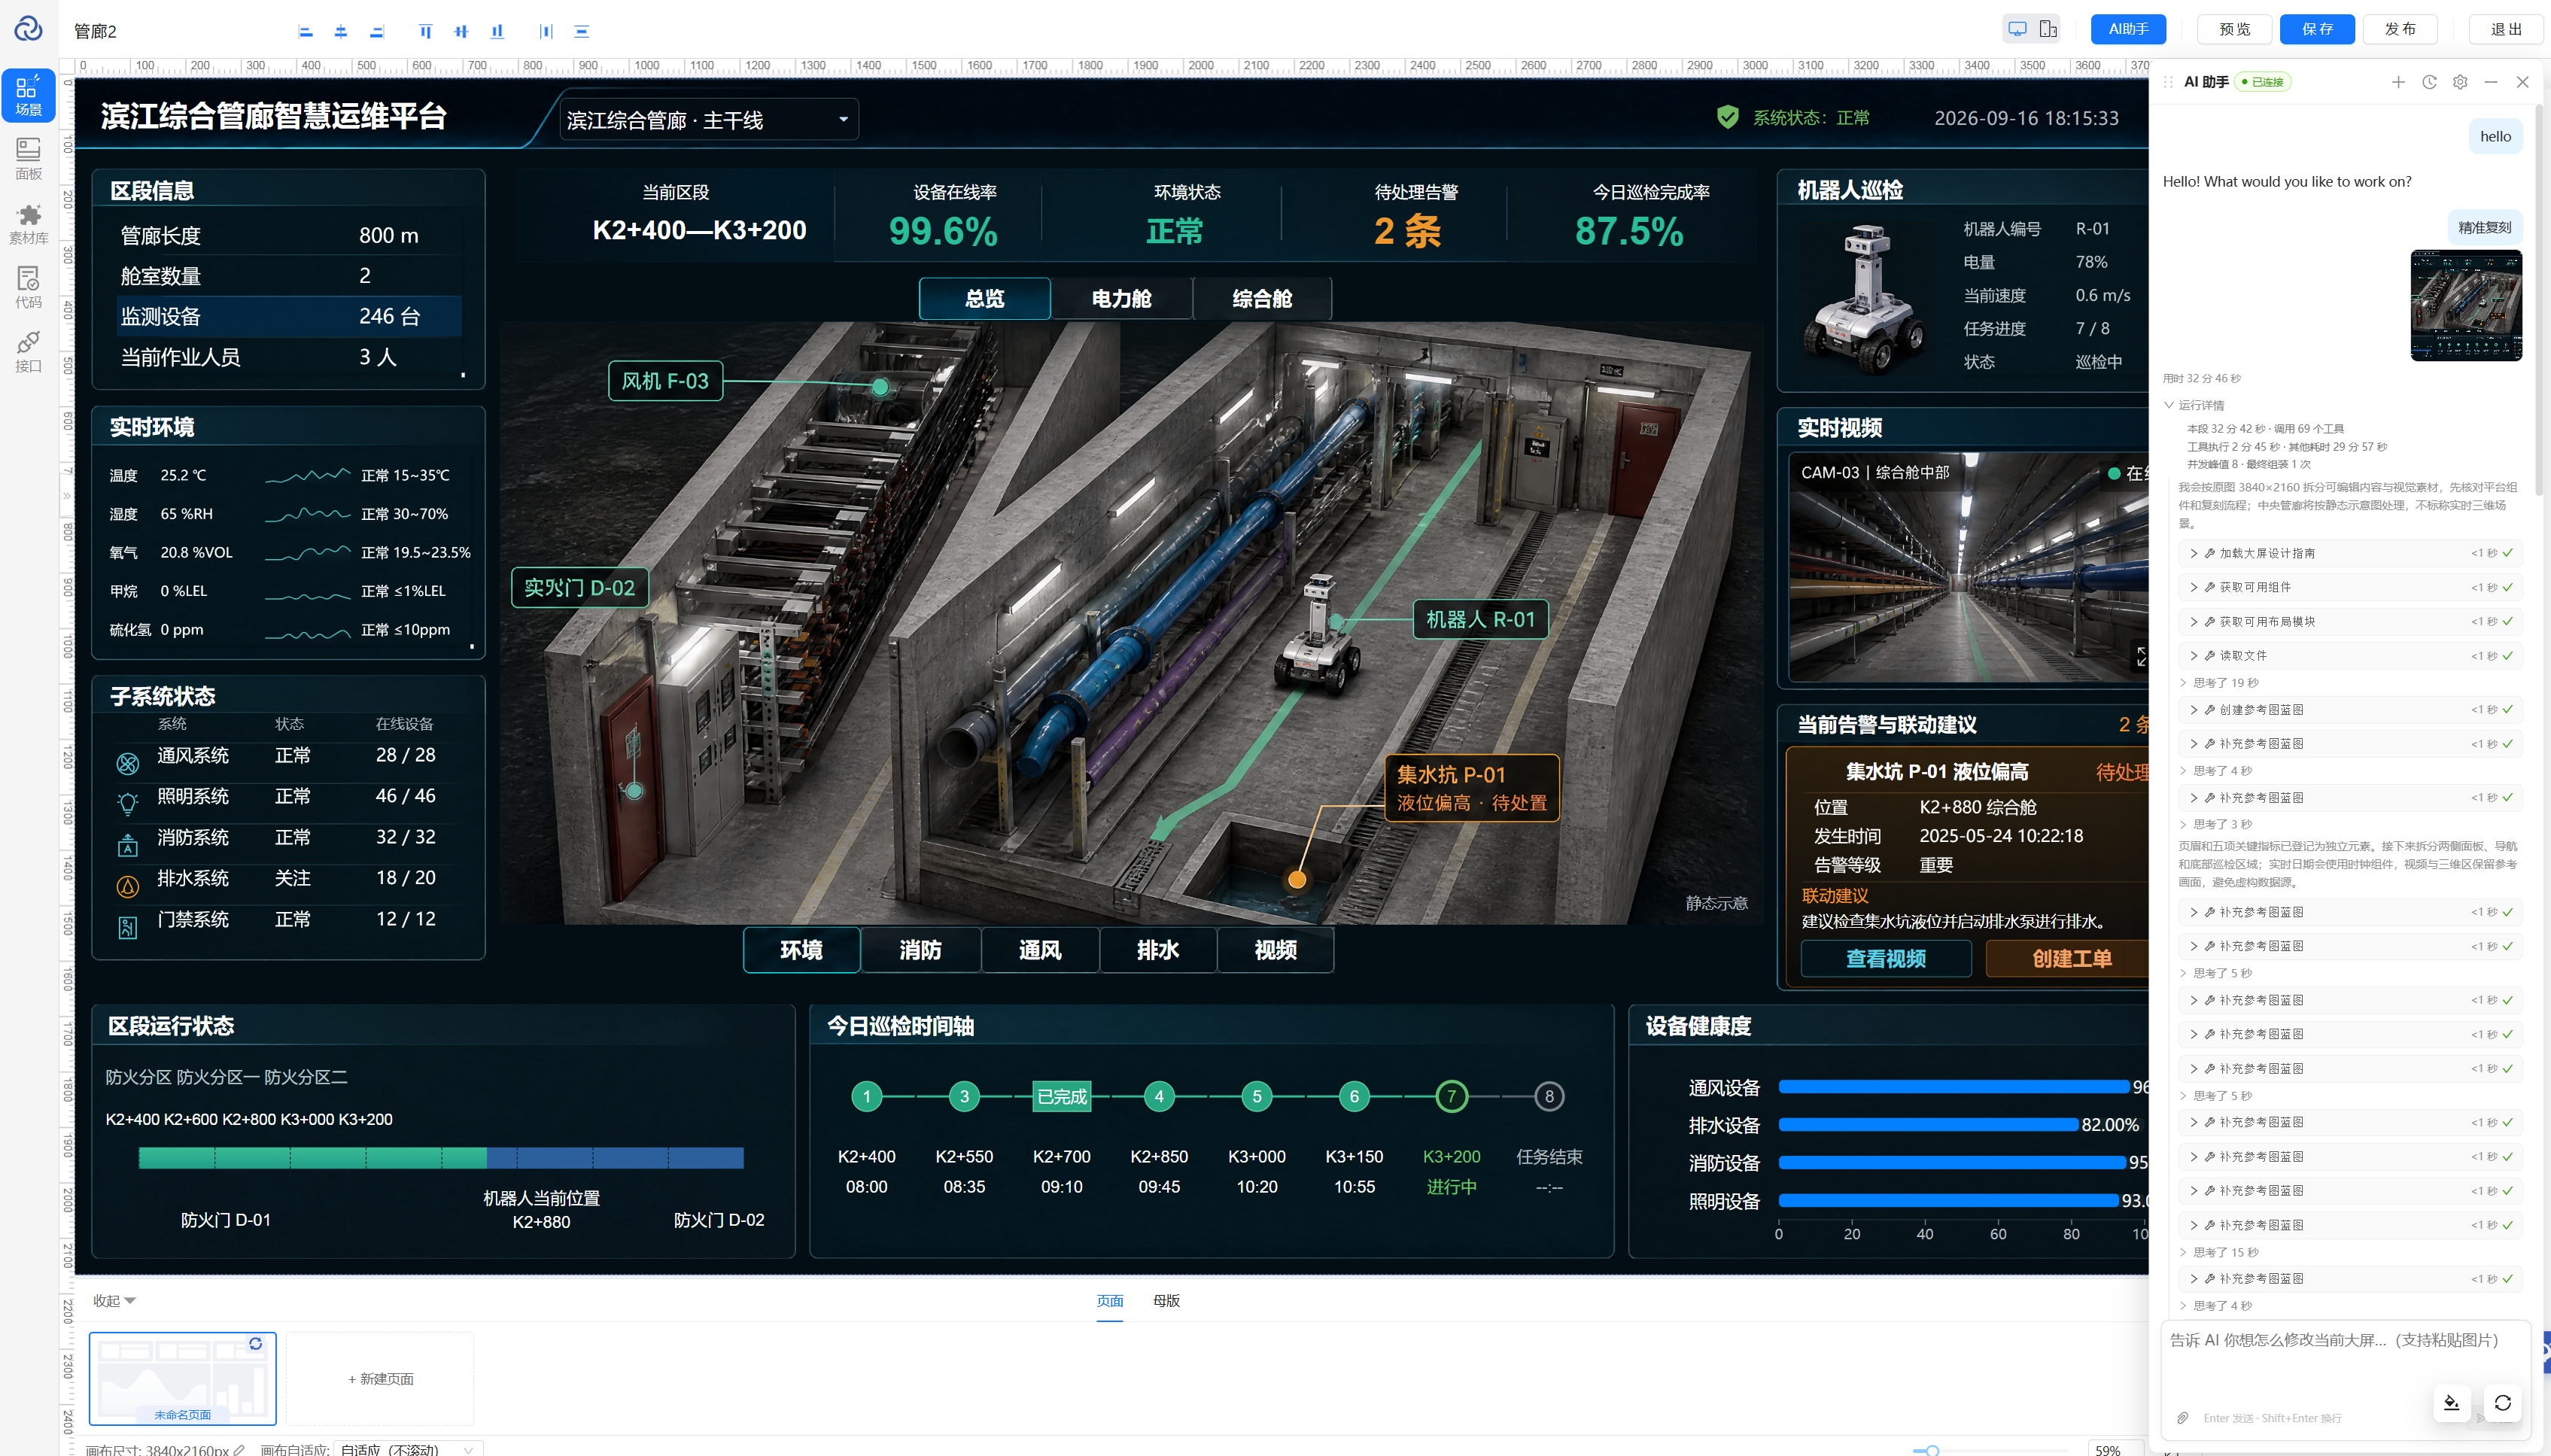
Describe the charts, metric cards, menus and dialogs you need. AI generates components and their interactions, helping viewers switch perspectives, explore details and understand the business behind the overview.
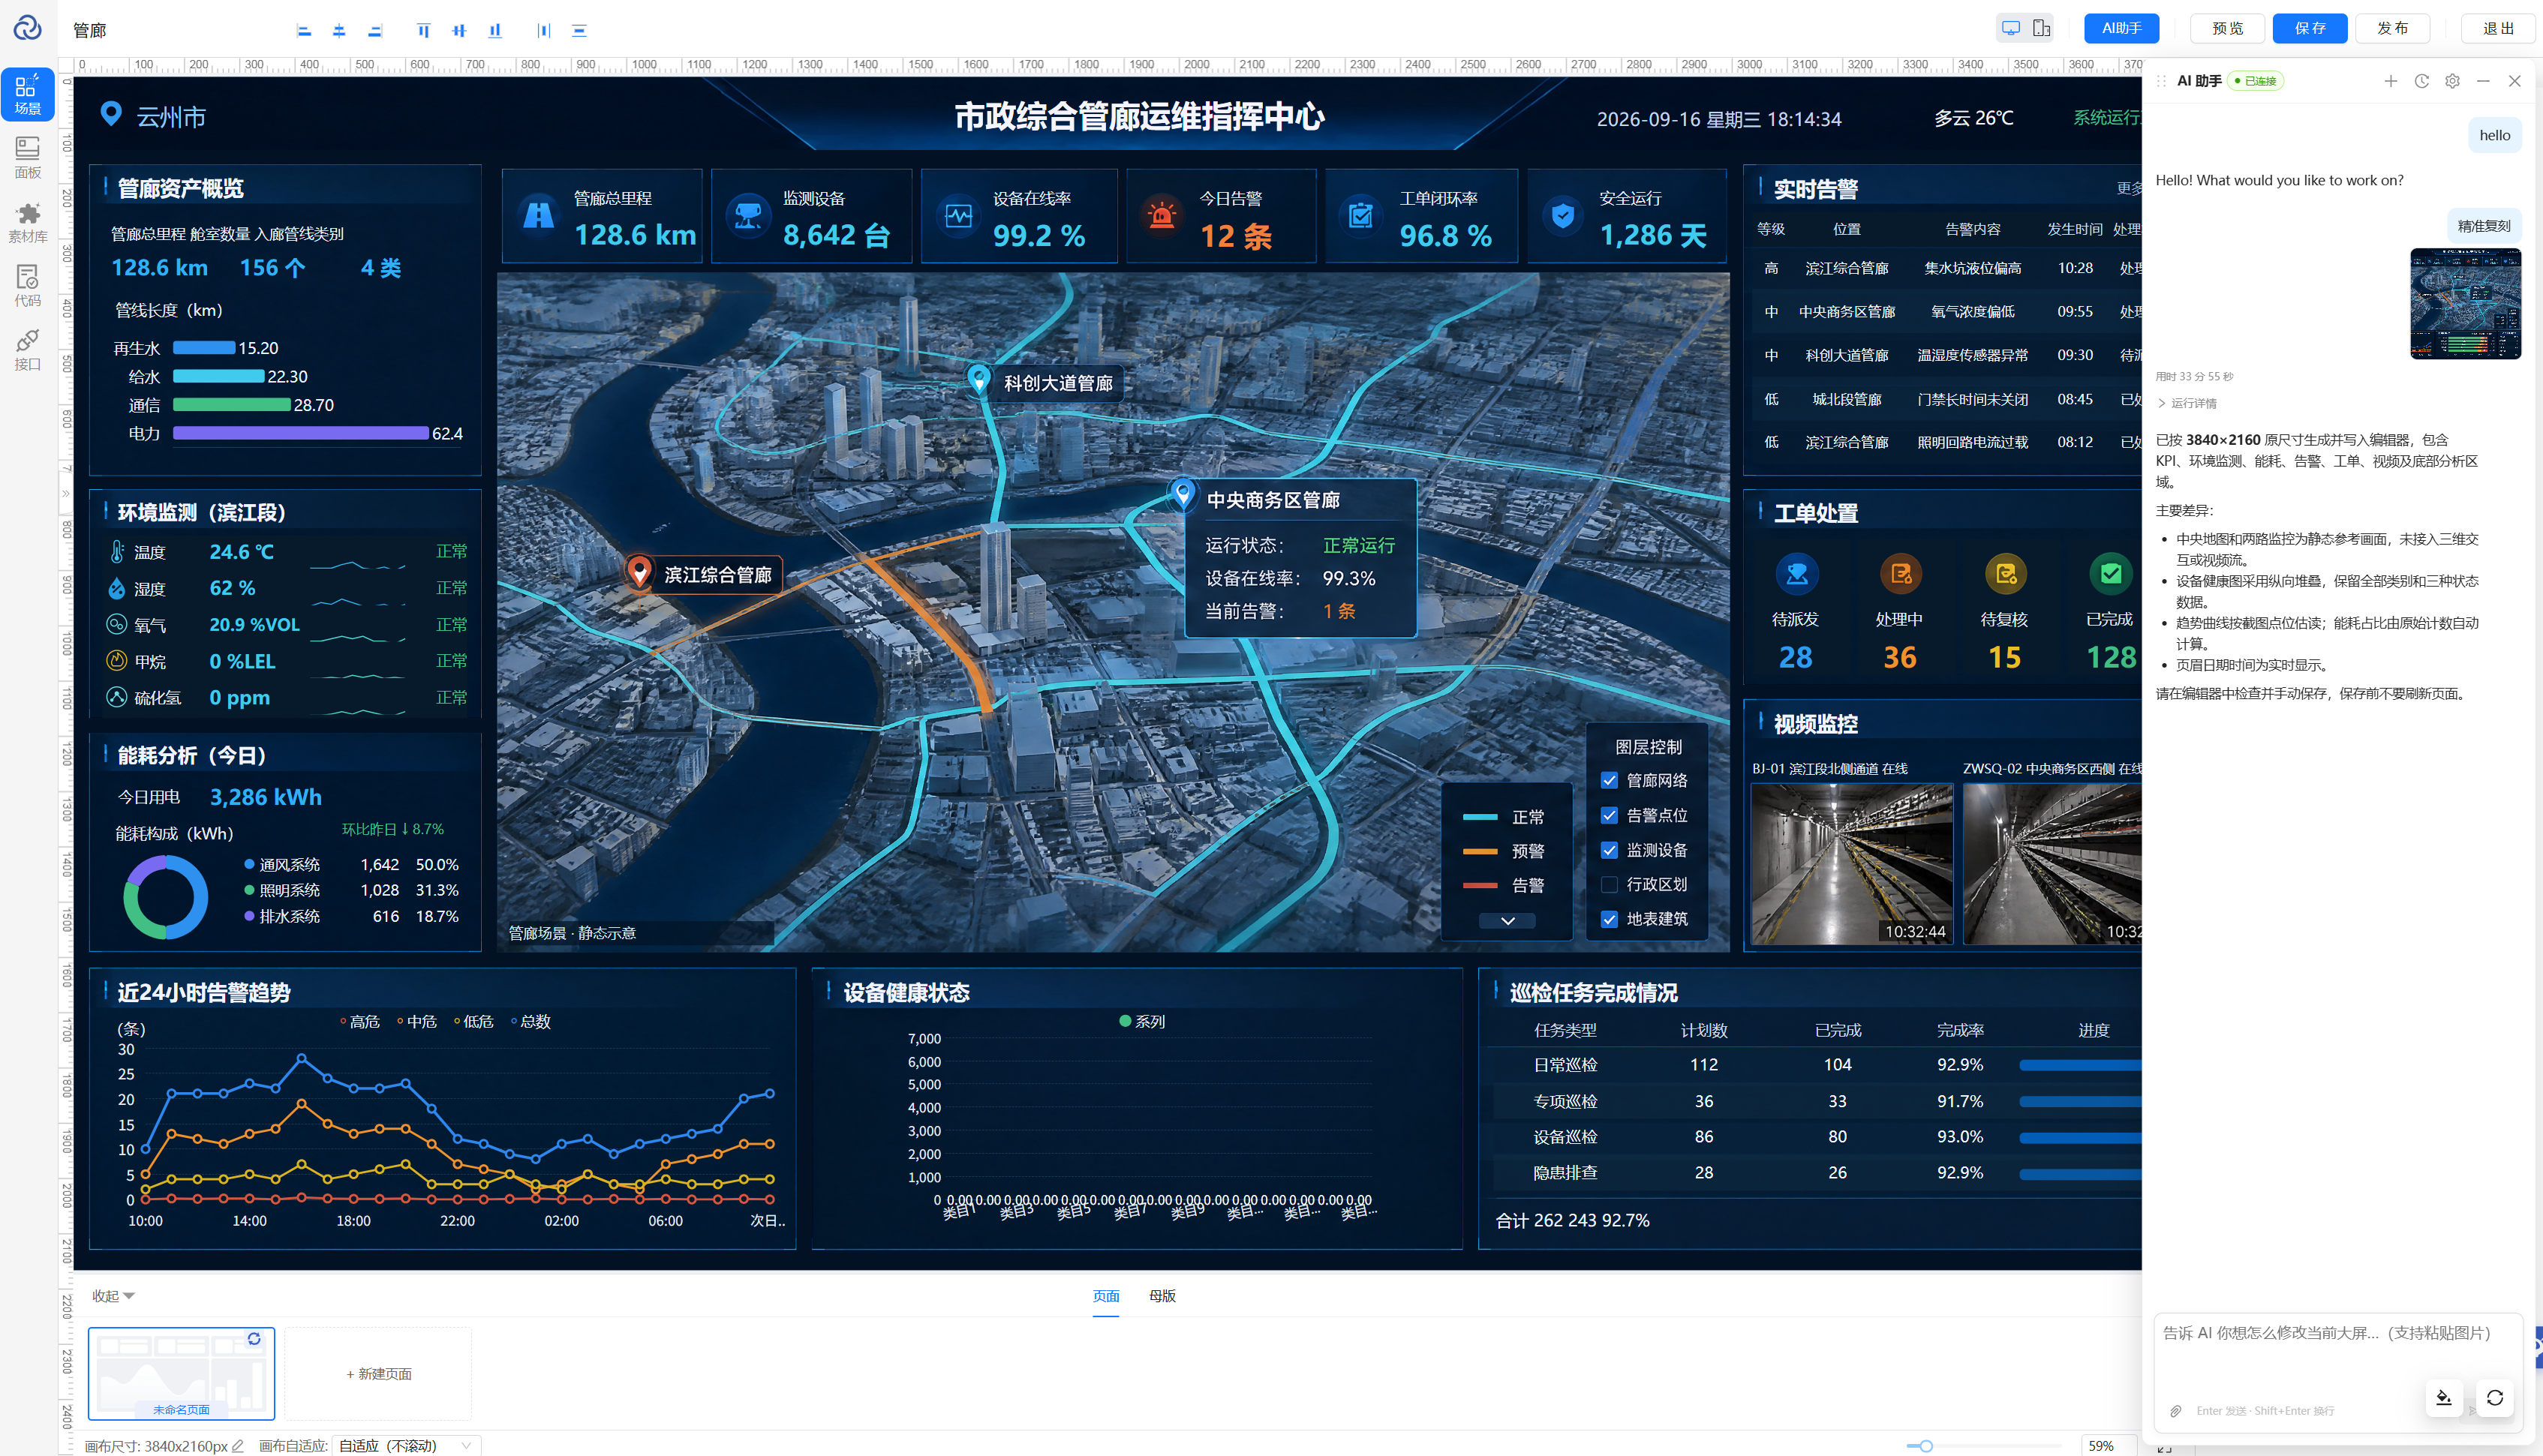
Review the preview, then use conversation to refine layouts, interactions and dialogs. Combine AI assistance with visual editing to bring drafting, refinement and publishing into one workflow.
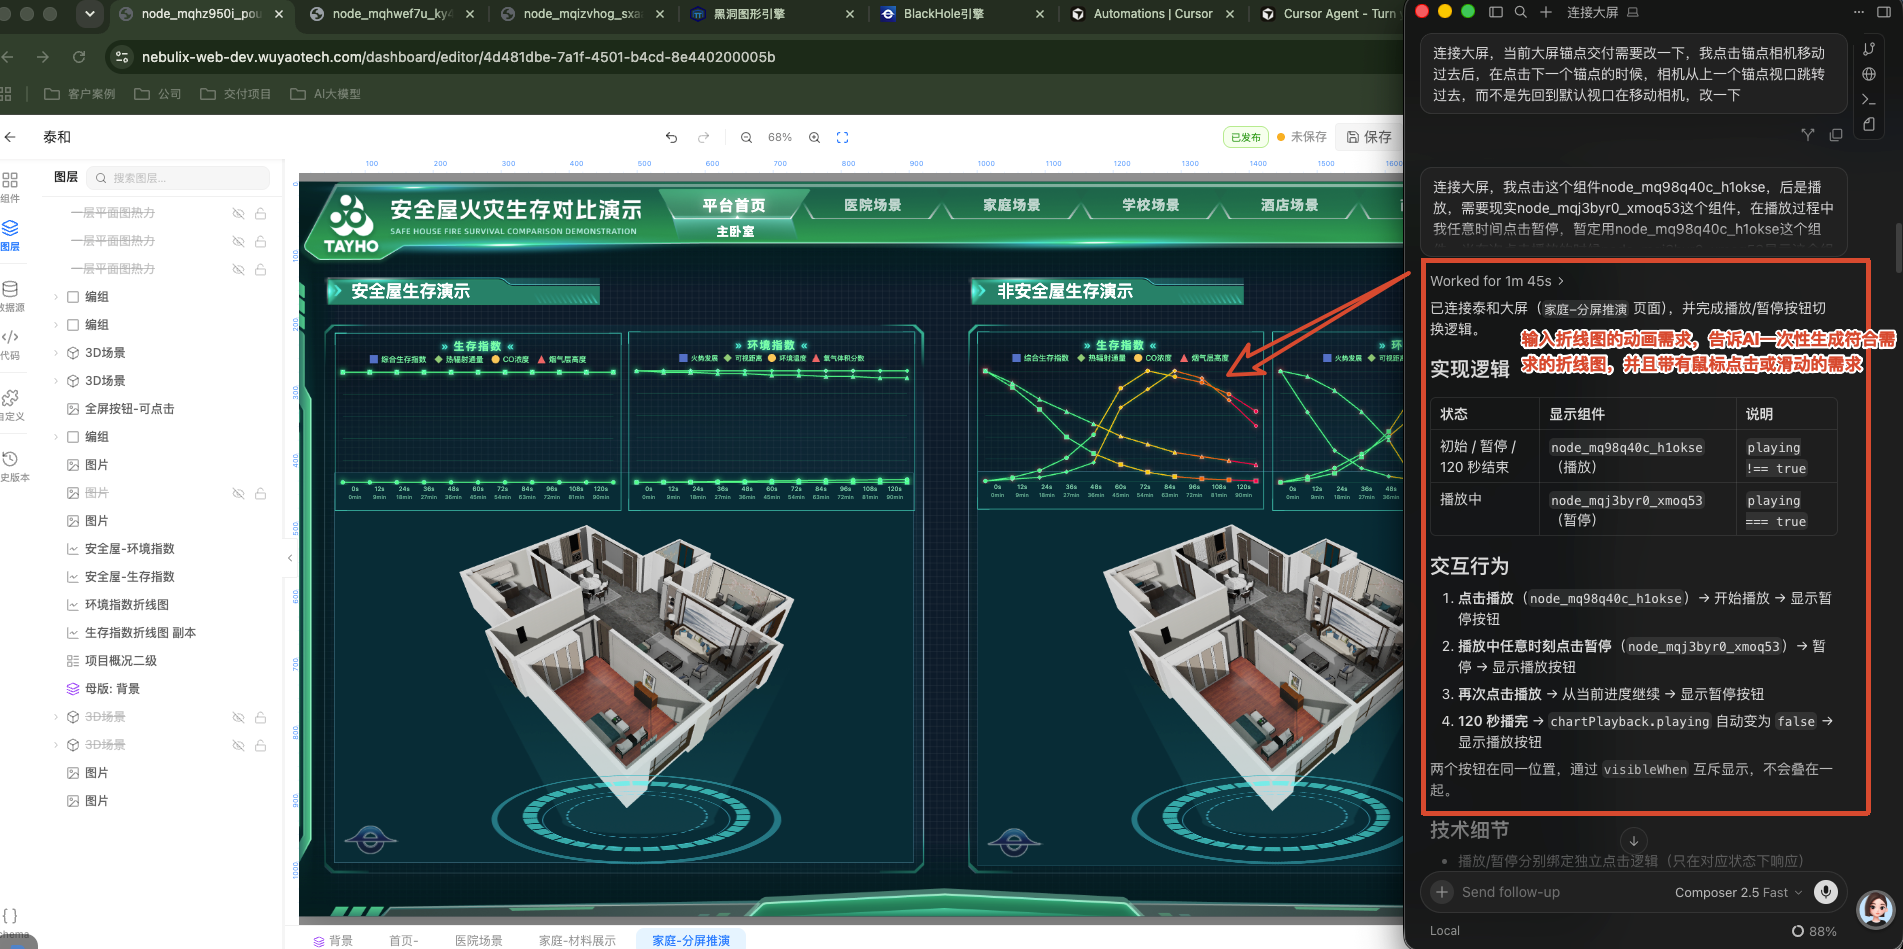
Use animated charts to explain trends that static numbers cannot easily convey. Describe the indicators and animation you need; AI helps create the charts and playback controls for clearer presentations and process reviews.
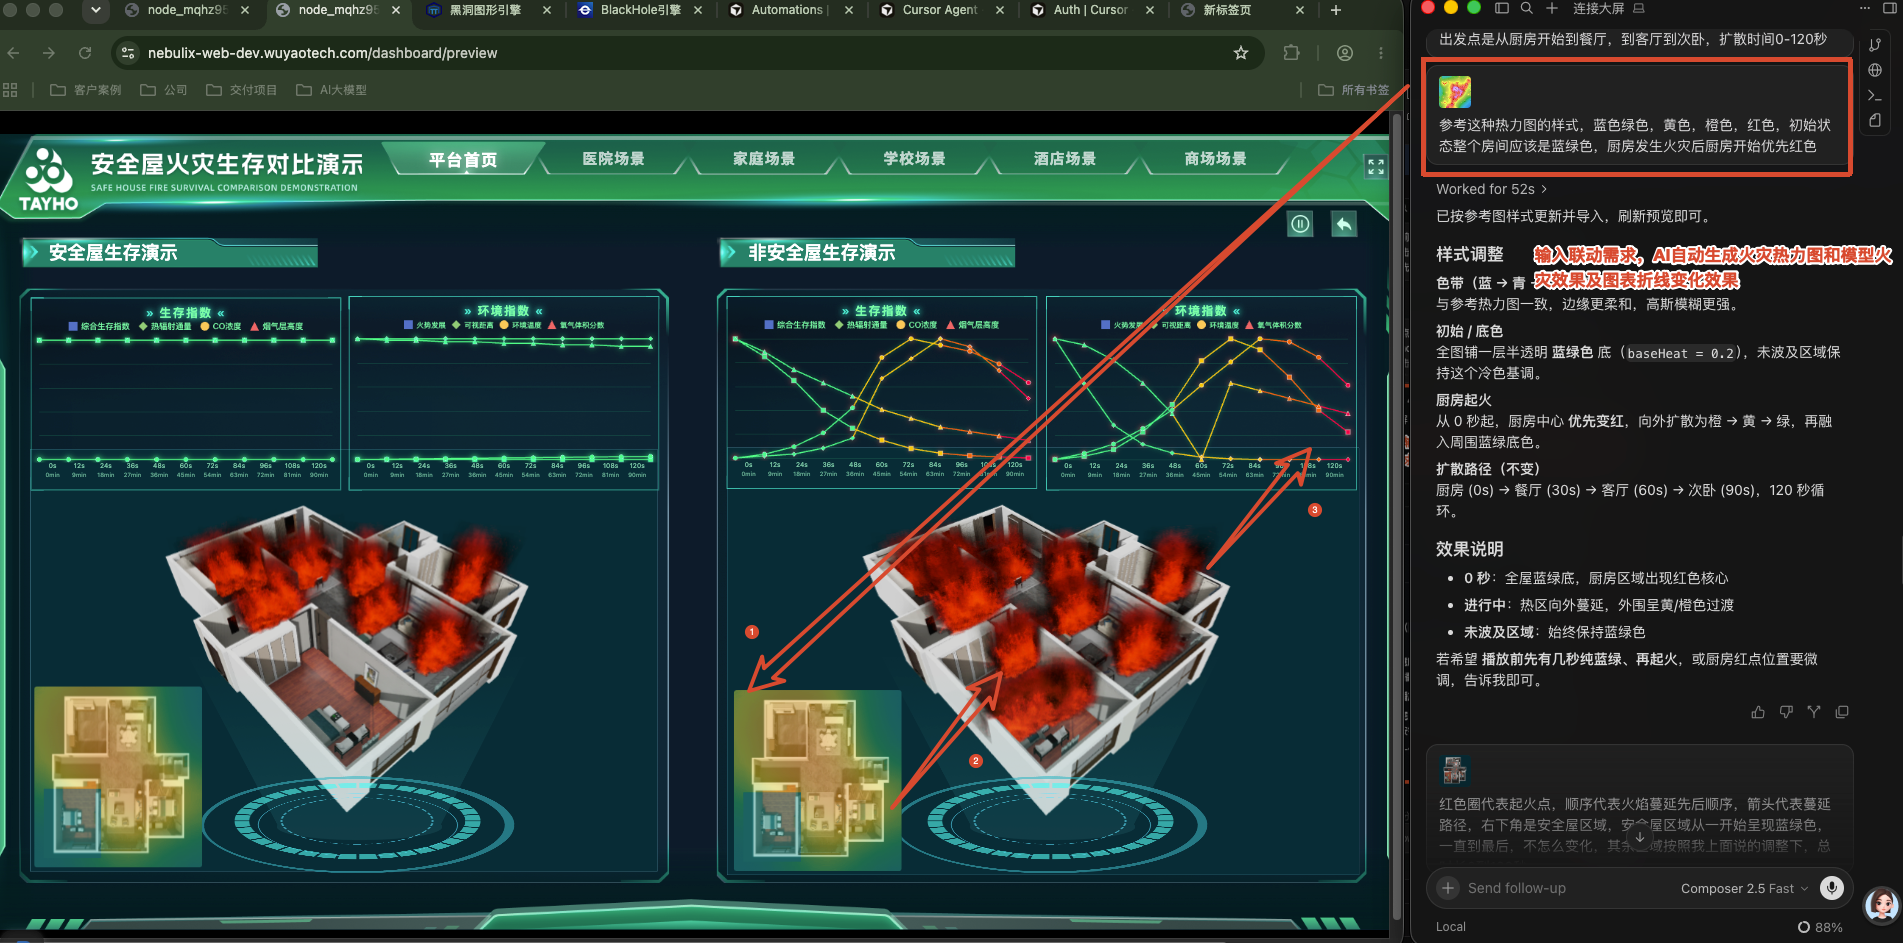
Show where activity is concentrated and which areas need attention. Use business requirements and visual references to generate heatmaps and scene effects, then refine their presentation through conversation.
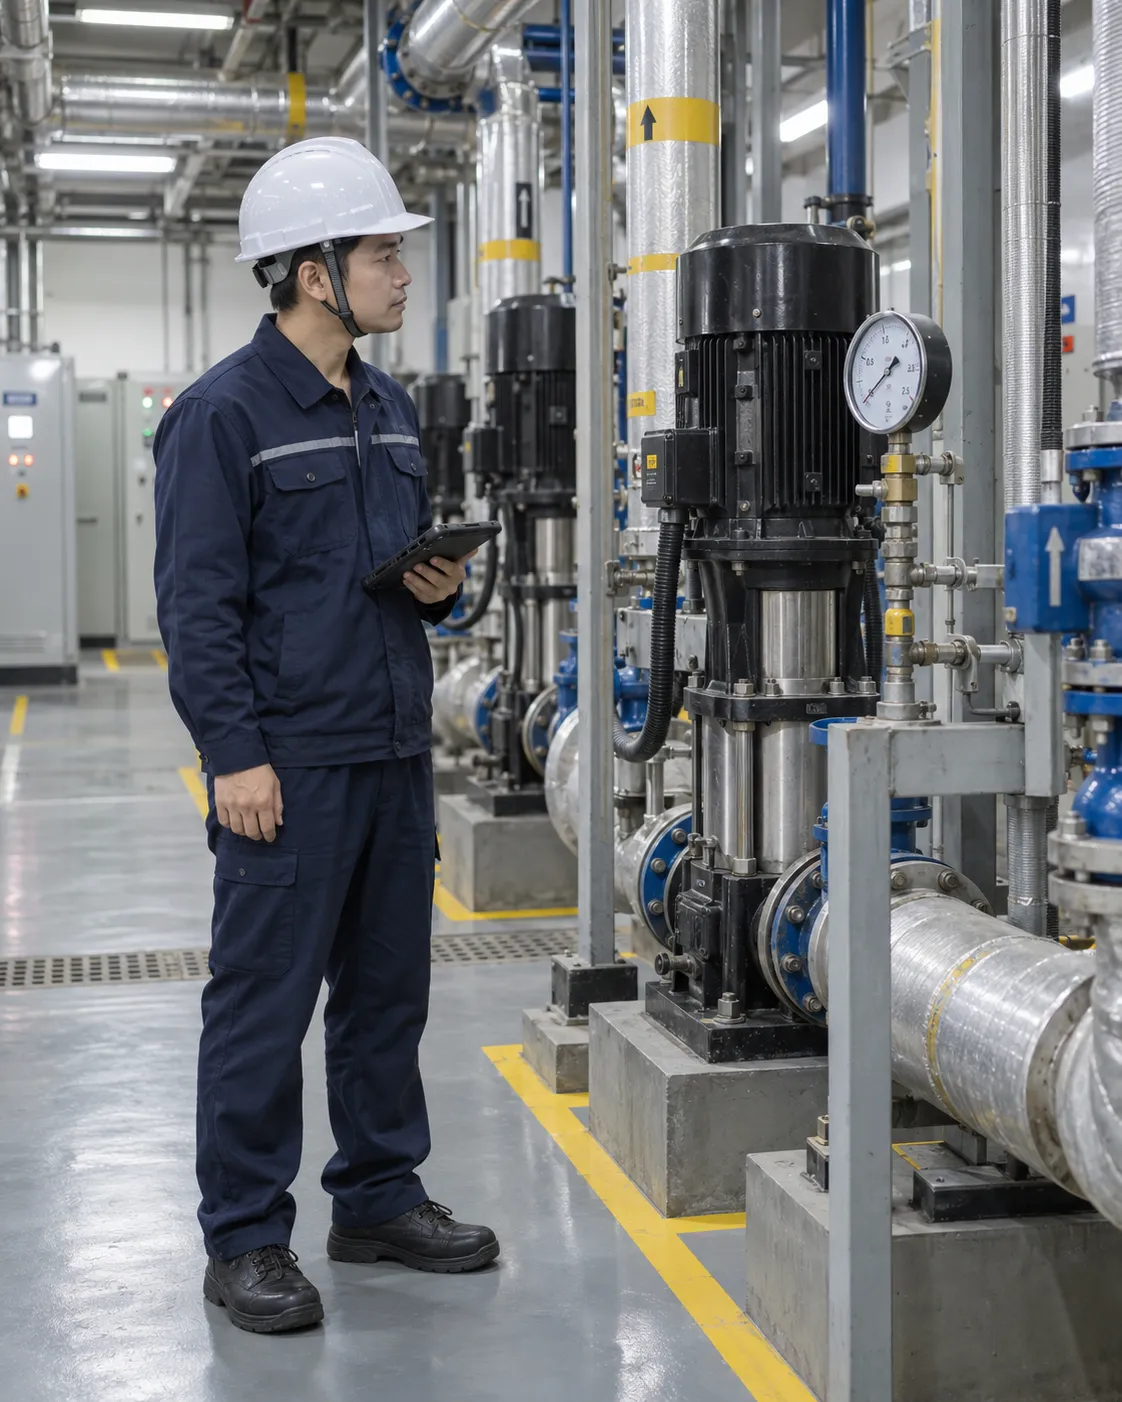
Combine spatial views, operational indicators and live status into a focused monitoring display.
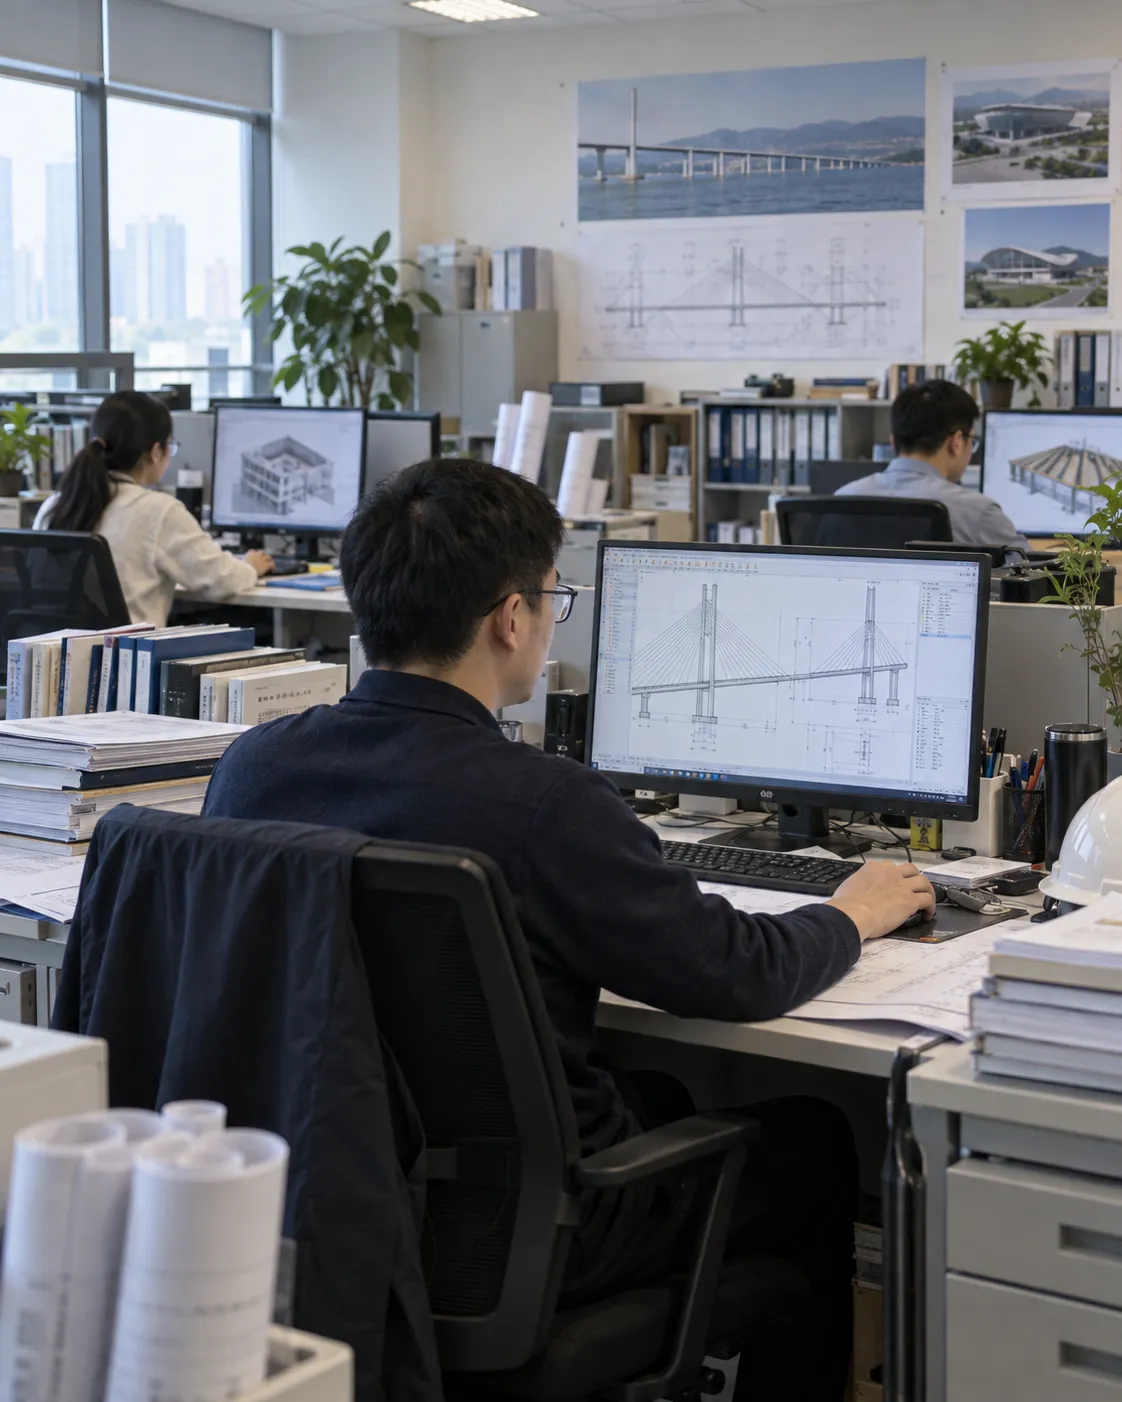
Configure and reuse display components across projects while maintaining common visual and data standards.
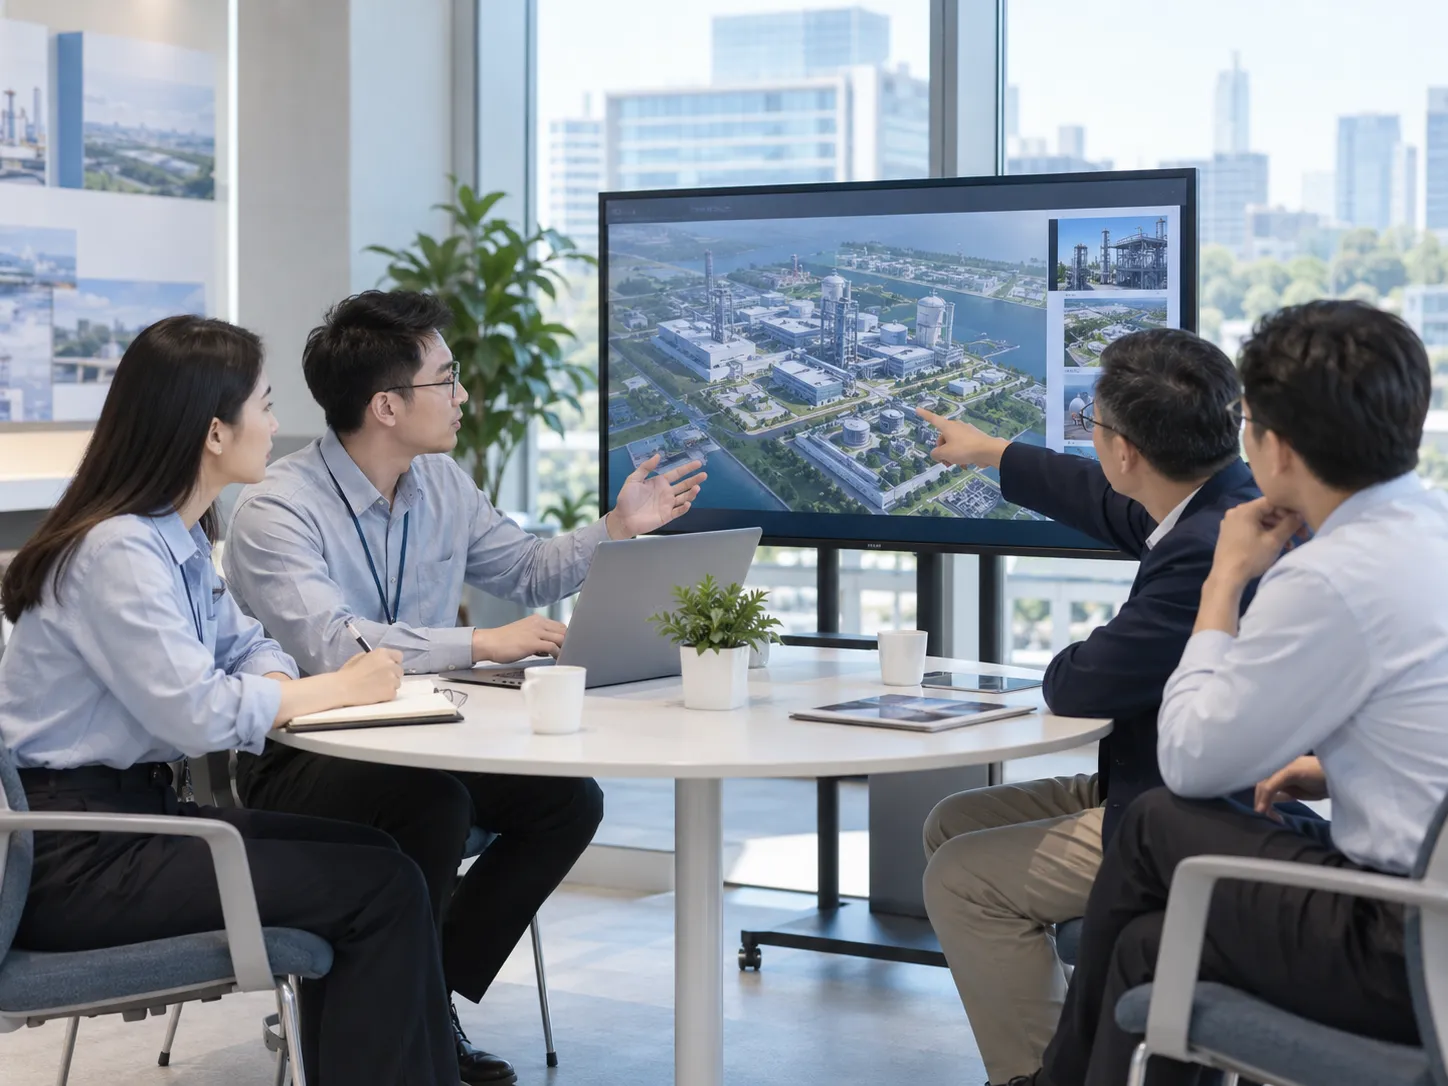
Prepare project presentations and exhibition displays with editable 3D scenes and business data.
Tell us about the target scene, data sources and display resolution, and we will prepare a relevant demonstration.
Book a product demo